
The problem we’re solving
If you rent out an apartment through Airbnb, Booking.com, or directly, you know how it goes: your numbers are scattered across emails, bank statements, and your head. You don’t know exactly:
- how much of your gross revenue you actually keep after platform commissions,
- what your actual occupancy rate and average nightly rate are,
- whether you met your budget this month — and why not (lower rate, or lower occupancy?),
- how you’re doing across multiple properties at the same time.
You can certainly put spreadsheets together in Excel yourself, but it takes hours — and a single error in a formula can skew your entire picture.
Solution: RENTAL MANAGEMENT
A complete financial and operational overview that takes your data from a single transaction all the way to annual net profit — automatically, clearly, and without having to calculate anything manually.
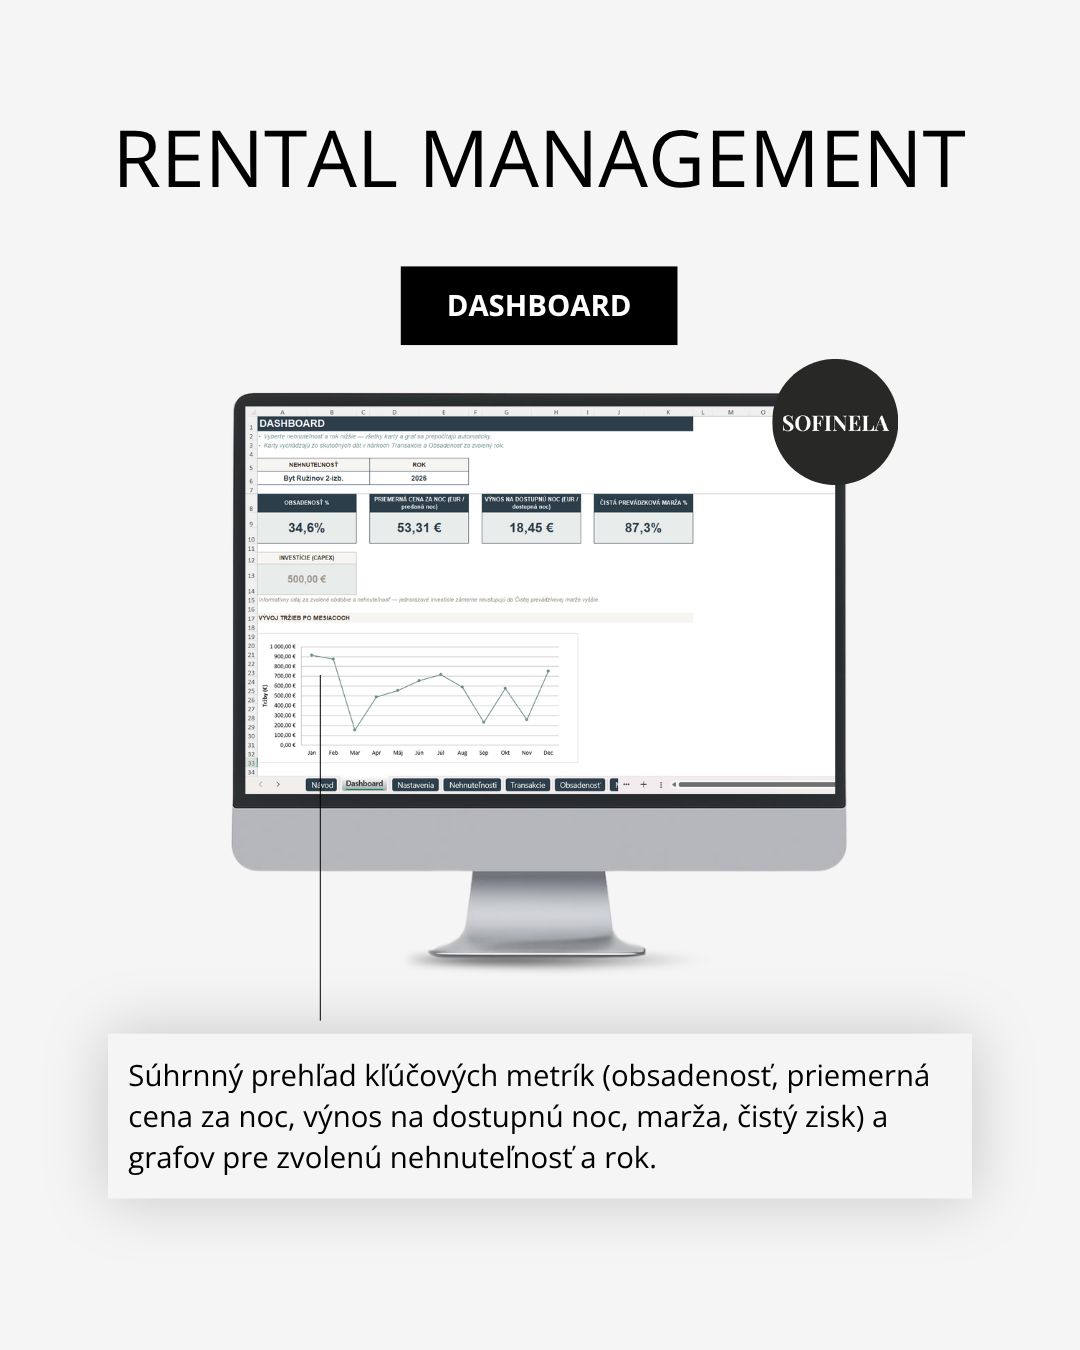
Just enter your transactions and expenses, and the rest — the dashboard, charts, cards, and budget comparison — recalculates on its own. All cards and charts on the Dashboard are filtered by the selected property and year — ideal if you manage a portfolio of apartments.
You get the product in Google Sheets or Excel format – Work where you’re used to working — with no need to import or convert anything.
Note: In older versions of Excel (2019 and earlier), the formulas will not work correctly.
What exactly you get
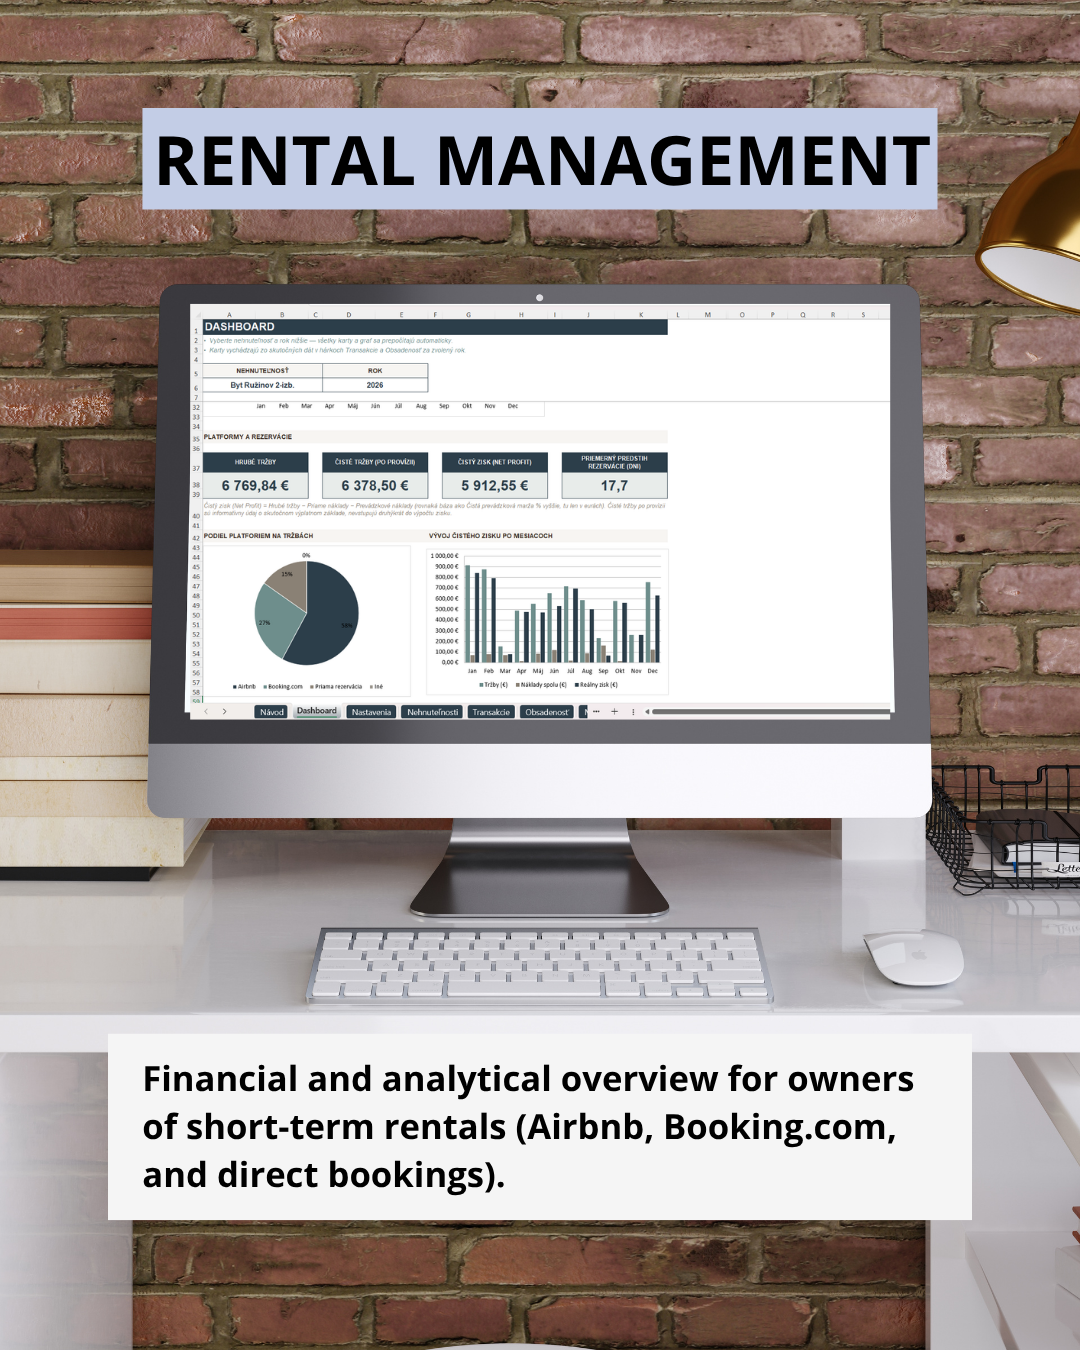
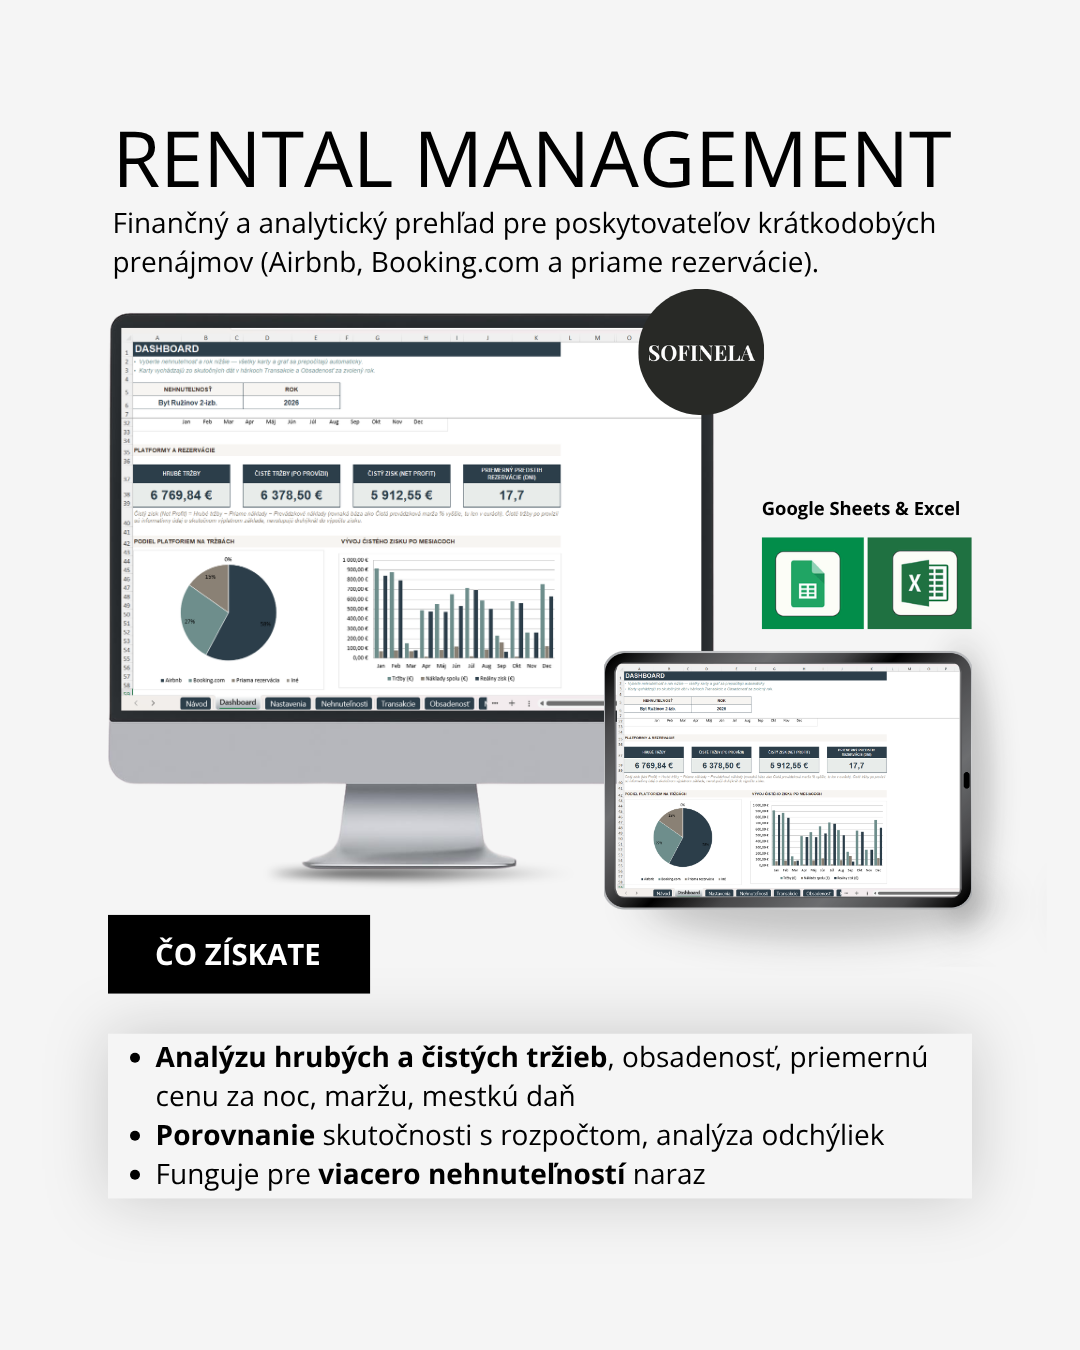
Clear Dashboard – One place where you can see gross revenue, net revenue (after commissions), net profit, and average nightly rate — with charts by platform and profit development by month.
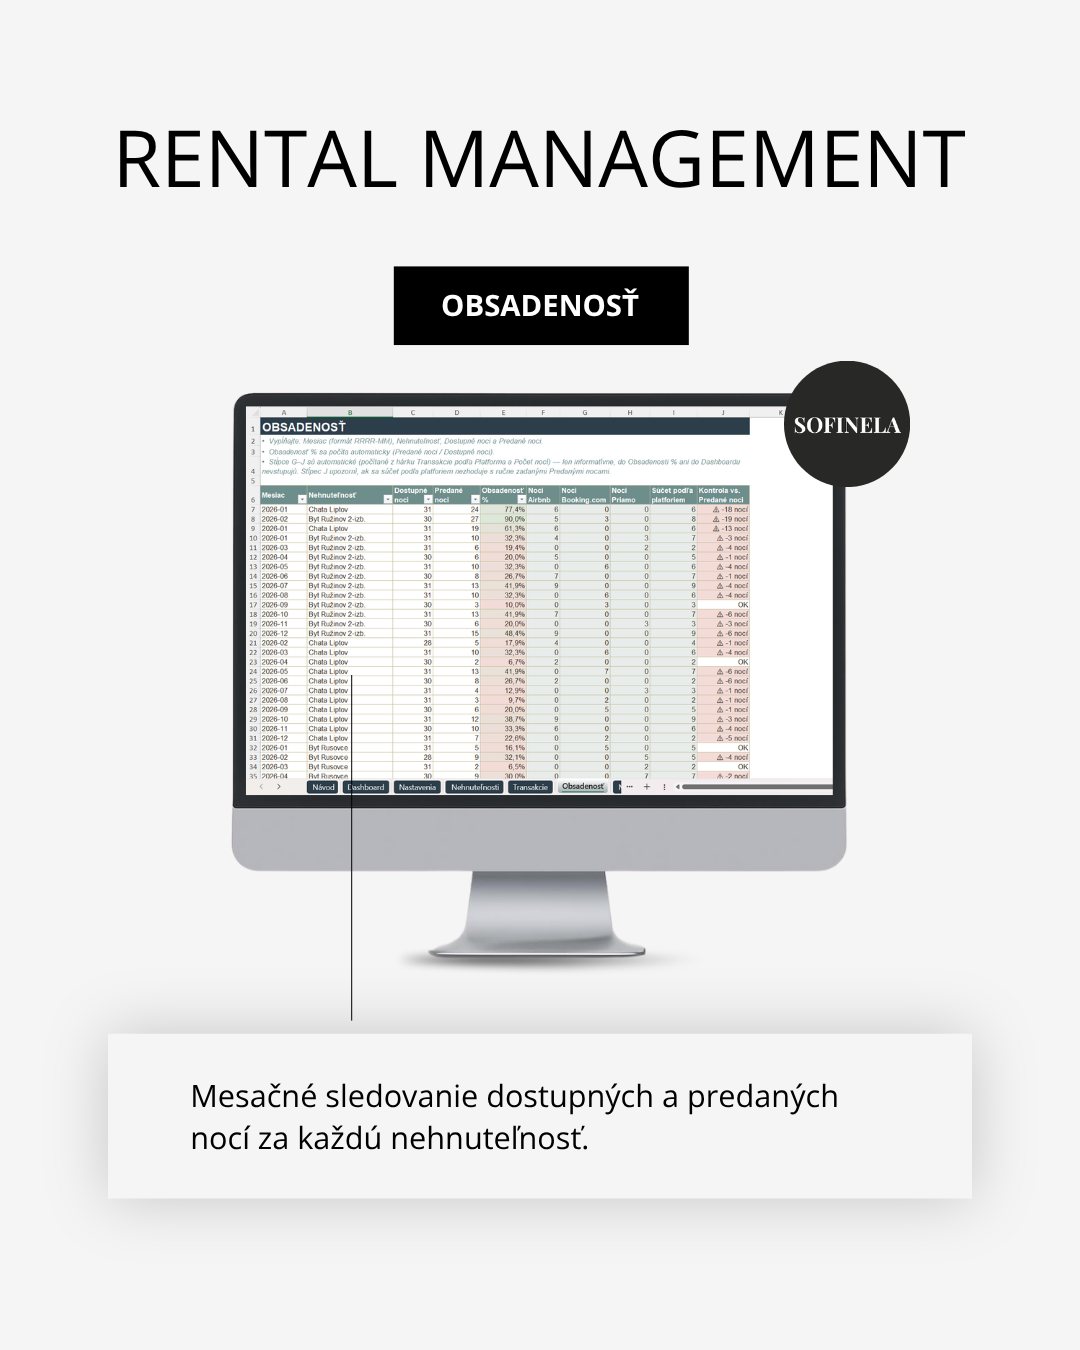
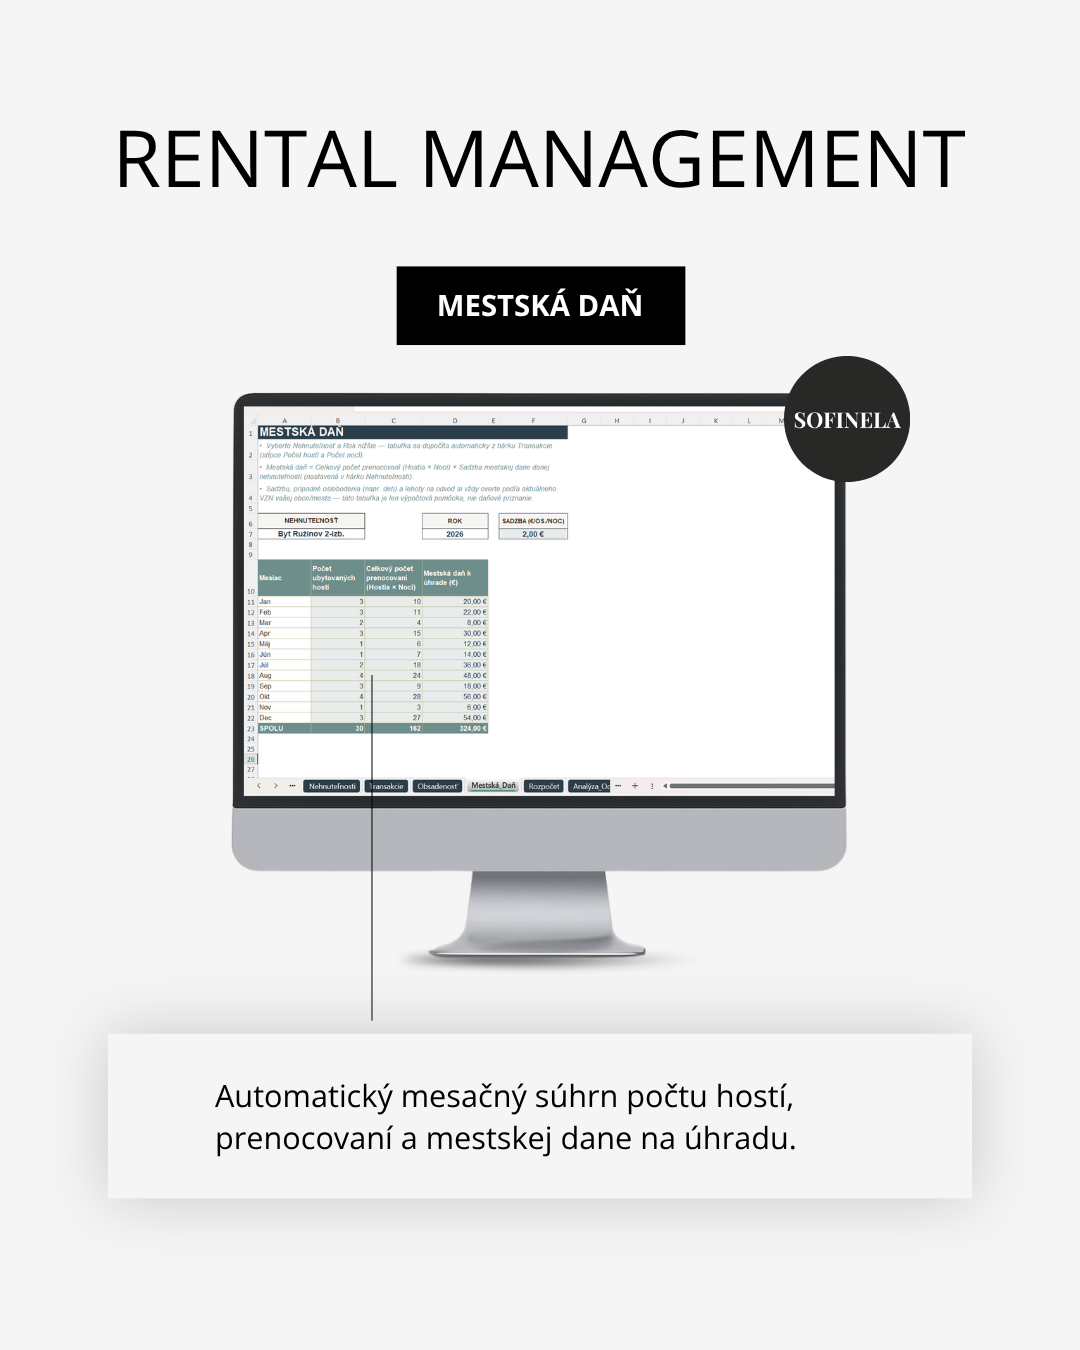
Analysis of both gross and net revenue – Track revenue after deducting each platform’s commissions, occupancy, average nightly rate, revenue per available night, operating margin, and city tax — for each property separately.
Comparison of actuals against budget – an answer to whether any deviation from the plan was caused by a lower nightly rate or by lower occupancy — so you know where to step in.
Who it’s ideal for
- Owners of one or more apartments for short-term rental
- Property managers managing properties for multiple clients
- Investors who want an overview of their portfolio’s performance in one place.
How Google Sheets works
You’ll receive a link to a shared Google Sheet by email.
- You create your own copy (File → Make a copy) — from that moment on, the document is fully editable and belongs only to you.
- You fill in your data — transactions and expenses. The dashboard, charts, and analyses recalculate automatically.
No installation, no plugins, no complicated setup.
Why Rental Management and not your own Excel?
Building a similar overview from scratch takes hours (often days) of work and carries the risk of formula errors. Rental Management is a ready-made, tested tool — you focus on renting, not on spreadsheets.
Note: the file is protected by copyright law — distribution, resale, or making it available to third parties is not permitted.